Assessment |
Biopsychology |
Comparative |
Cognitive |
Developmental |
Language |
Individual differences |
Personality |
Philosophy |
Social |
Methods |
Statistics |
Clinical |
Educational |
Industrial |
Professional items |
World psychology |
Statistics: Scientific method · Research methods · Experimental design · Undergraduate statistics courses · Statistical tests · Game theory · Decision theory
Failure rate is the frequency with an engineered system or component fails, expressed for example in failures per hour. It is often denoted by the Greek letter (lambda) and is important in reliability theory.

Failure rate is usually time dependent. For example, as an automobile grows older, the failure rate in its fifth year of service may be greater than its failure rate during its first year of service. However, in the special case when the likelihood of failure remains constant as time passes, failure rate is simply the inverse of the mean time to failure, expressed for example in hours per failure.
Failure rate in the discrete sense[]
In words appearing in an experiment, the failure rate can be defined as
- The total number of failures within an item population, divided by the total time expended by that population, during a particular measurement interval under stated conditions. (MacDiarmid, et al.)
Here failure rate can be thought of as the probability that a failure occurs in a specified interval, given no failure before time . It can be defined with the aid of the reliability function or survival function , the probability of no failure before time , as:


where (or ) and are respectively the beginning and ending of a specified interval of time spanning . Note that this is a conditional probability, hence the in the denominator.


Failure rate in the continuous sense[]
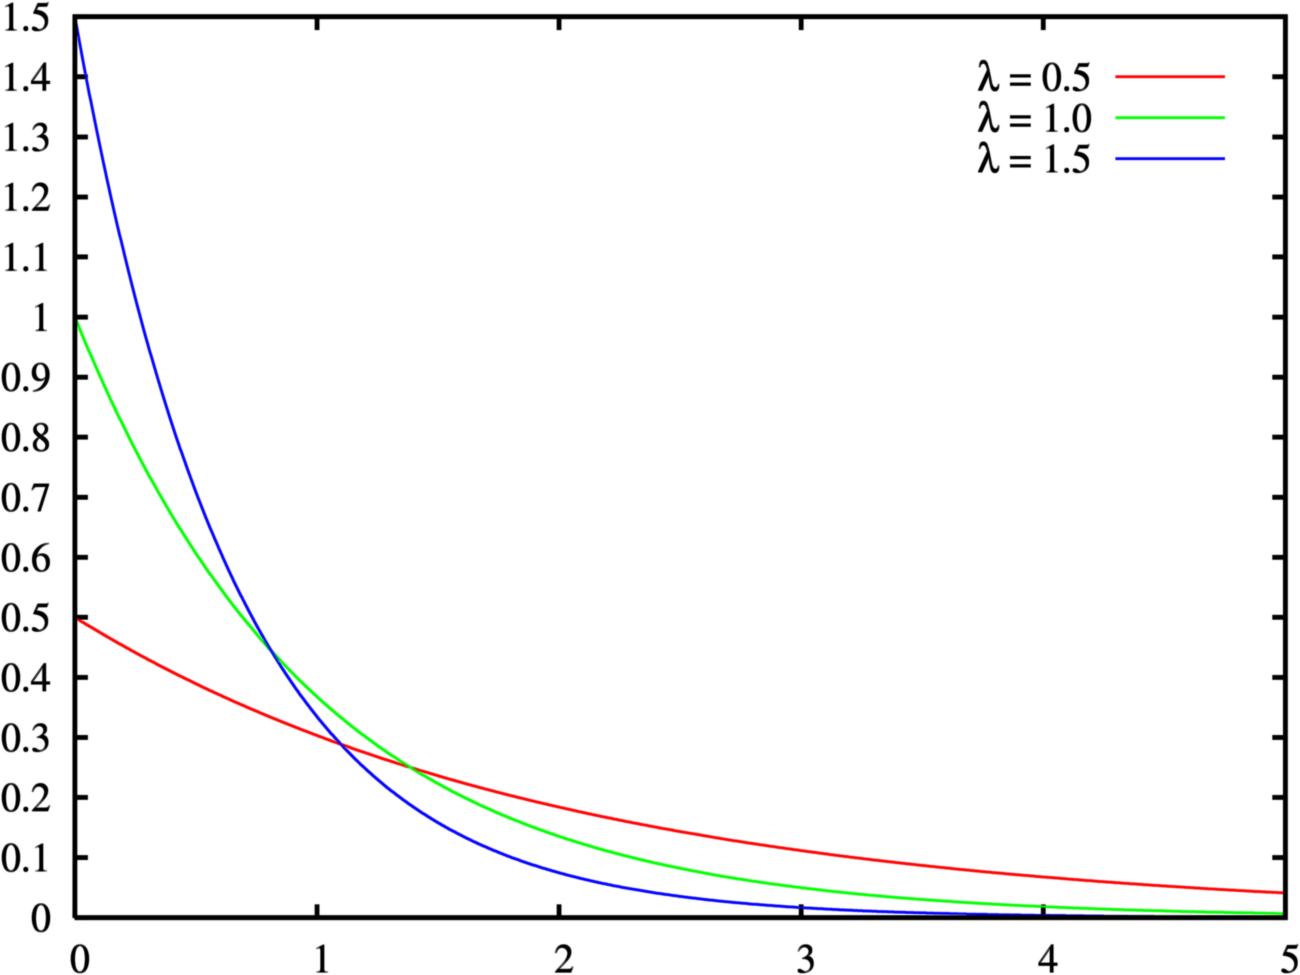
Exponential failure density functions
By calculating the failure rate for smaller and smaller intervals of time , the interval becomes infinitesimally small. This results in the hazard function, which is the instantaneous failure rate at any point in time:
- .

Continuous failure rate depends on a failure distribution, , which is a cumulative distribution function that describes the probability of failure prior to time ,

- .

The failure distribution function is the integral of the failure density function, ,

- .

The hazard function can be defined now as
- .

There are many failure distributions (see List of important probability distributions). A common failure distribution is the exponential failure distribution,
- ,

which is based on the exponential density function. This leads to a constant hazard rate. For other distributions, such as the Weibull distribution, log-normal distribution, or bathtub curve, the hazard function is not constant, which means that the failure rate varies with time.
Failure rate data[]
Failure rate data can be obtained in several ways. The most common means are:
- Historical data about the device or system under consideration.
- Many organizations maintain internal databases of failure information on the devices or systems that they produce, which can be used to calculate failure rates for those devices or systems. For new devices or systems, the historical data for similar devices or systems can serve as a useful estimate.
- Government and commercial failure rate data.
- Handbooks of failure rate data for various components are available from government and commercial sources. MIL-HDBK-217, Reliability Prediction of Electronic Equipment, is a military standard that provides failure rate data for many military electronic components. Several failure rate data sources are available commercially that focus on commercial components, including some non-electronic components.
- Testing.
- The most accurate source of data is to test samples of the actual devices or systems in order to generate failure data. This is often prohibitively expensive or impractical, so that the previous data sources are often used instead.
Units[]
Failure rates can be expressed using any measure of time, but hours is the most common unit in practice. Other units, such as miles, revolutions, etc., can also be used in place of "time" units.
Failure rates are often expressed in engineering notation as failures per million, or , especially for individual components, since their failure rates are often very low.

The Failures In Time (FIT) rate of a device is the number of failures that can be expected in one billion (109) hours of operation. This term is used particularly by the semiconductor industry.
Additivity[]
Under certain engineering assumptions, the failure rate for a complex system is simply the sum of the individual failure rates of its components, as long as the units are consistent, e.g. failures per million hours. This permits testing of individual components or subsystems, whose failure rates are then added to obtain the total system failure rate.
Example[]
Suppose it is desired to estimate the failure rate of a certain component. A test can be performed to estimate its failure rate. Ten identical components are each tested until they either fail or reach 1000 hours, at which time the test is terminated for that component. (The level of statistical confidence is not considered in this example.) The results are as follows:
| Component | Hours | Failure |
| Component 1 | 1000 | No failure |
| Component 2 | 1000 | No failure |
| Component 3 | 467 | Failed |
| Component 4 | 1000 | No failure |
| Component 5 | 630 | Failed |
| Component 6 | 590 | Failed |
| Component 7 | 1000 | No failure |
| Component 8 | 285 | Failed |
| Component 9 | 648 | Failed |
| Component 10 | 882 | Failed |
| Totals | 7502 | 6 |
Estimated failure rate is,
,

or 799.8 failures for every million hours of operation.
See also[]
- Failure
- Failure mode
- Reliability
- Reliability theory
- Reliability theory of aging and longevity
- Reliability engineering
- Survival analysis
- Weibull distribution
- MTBF
- Annualized failure rate
- Burn in
References[]
Print[]
- Blanchard, Benjamin S. (1992), Logistics Engineering and Management, Fourth Ed., pp 26-32, Prentice-Hall, Inc., Englewood Cliffs, New Jersey.
- Ebeling, Charles E., (1997), An Introduction to Reliability and Maintainability Engineering, pp 23-32, McGraw-Hill Companies, Inc., Boston.
- Federal Standard 1037C
- Kapur, K.C., and Lamberson, L.R., (1977), Reliability in Engineering Design, pp 8-30, John Wiley & Sons, New York.
- Knowles, D.I.,(1995), Should We Move Away From "Acceptable Failure Rate", Communications in Reliability Maintainability and Supportability, Vol. 2, No. 1, P. 23, International RMS Committee, USA
- MacDiarmid, Preston; Morris, Seymour; et. al., (no date), Reliability Toolkit: Commercial Practices Edition, pp 35-39, Reliability Analysis Center and Rome Laboratory, Rome, New York.
- Turner, T., Hockley, C., and Burdaky, R., (1997), The Customer Needs A Maintenance-Free Operating Period, 1997 Avionics Conference and Exhibition, No. 97-0819, P. 2.2, ERA Technology Ltd., Leatherhead, Surrey, UK
Online[]
- Mondro, Mitchell J, (June 2002), "Approximation of Mean Time Between Failure When a System has Periodic Maintenance", IEEE Transactions on Reliability, v 51, no 2. (available from MITRE Corp.)
- Reliability Prediction of Electronic Equipment, MIL-HDBK-217F(2), (DOD download site.)
- Bathtub curve issues by ASQC.
External links[]
- MTBF and reliability prediction Knowledge Base
- Google Answers (TM) question on MTBF.
- Usenet FAQ about MTBF.
- Reliability and Availability Basics
- MTBF FAQ and MTBF prediction software
- Product failure behaviour and wear out
- Burn in and reliability
de:Mean Time Between Failures es:MTBF fr:Moyenne des Temps de Bon Fonctionnement hu:MTBF pt:MTBF zh:MTBF
| This page uses Creative Commons Licensed content from Wikipedia (view authors). |